 The Alliance for Walking and Biking just released their 2010 Benchmarking report that covers statistics for bicycling and walking in the United States. Statistics that jumped out were:
Bicycling and Walking Levels
• 9.6% of all trips are by bicycle (0.9%) or foot (8.7%).
• 3.3% of commuters nationwide are bicyclists (0.5%) or pedestrians (2.8%).
• Residents of the largest U.S. cities are 1.8 times more likely to walk or bicycle to work than the national average.
• From 2000 to 2007, the number of commuters who bicycle to work increased by 42%.
Bicycle and Pedestrian Safety
• 13.1% of all traffic fatalities in the U.S. are bicyclists (1.8%) or pedestrians (11.3%).
• In the 51 largest U.S. cities, 4.8% of trips are by foot and 0.8% are by bicycle, yet 26.5% of traffic fatalities are pedestrians and 3.0% are bicyclists.
• Seniors are the most vulnerable age group comprising 9% of walking trips and 4% of bicycling trips, yet accounting for 19% of pedestrian fatalities and 9% of bicyclist fatalities.
Funding for Bicycling and Walking
• States spend just 1.2% of their federal transportation dollars on bicycling and walking. This
amounts to just $1.29 per capita.
Public Health and Bicycling and Walking
• While bicycling and walking levels fell 67% between 1960 and 2000, obesity levels increased by 241%.
• Between 1966 and 2001, the number of children who bicycled or walked to school fell 68%, while the percentage of obese children rose 367%.
• In general, states with the highest levels of bicycling and walking have the lowest levels of obesity, hypertension (high blood pressure), and diabetes and have the greatest percentage of adults who meet the recommended 30-plus minutes a day of physical activity.
In conclusion, the number of people participating in cycling has increased but so has the number of incidents. Cycling Safety
- Lookout for them (drivers) before they look out for you.
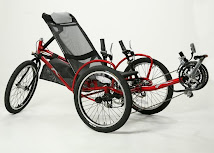
- Recumbent cycling flags on your recumbent bike or trike
- Helmet
- Bright colors (clothing)
- Ride on bike paths when possible
- Obey the laws of the road
Have fun, be safe!


+1.jpg)


No comments:
Post a Comment